Decoy Selection Algorithm
Exploring the Core of Zano's Privacy Mechanisms
One of the fundamental principles of privacy used by Zano is 'unlinkability' — a feature that prevents the association of transactions with each other. In creating a transaction, the sender references their own input and also includes a 'decoy set' — outputs from random transactions of other users. This incorporation of decoys ensures that, through a specialized Ring Signature, the sender is cryptographically proven to own only one of the inputs. However, it remains unknown to a third-party observer which specific input belongs to the sender.
In the first implementation of CryptoNote, the decoy mechanism was rudimentary, relying on randomly chosen outputs uniformly distributed across the entire blockchain history. The issue arose when a decoy was selected from a segment of the blockchain where the expected output was unlikely. This made the ring signature relatively easy to deanonymize with high confidence.
Researchers in Monero first noted that a flat distribution did not match the typical pattern of output usage. They undertook several iterations to improve their decoy set algorithm. At the time of writing, Monero's default model uses statistical analysis, presented as a log-gamma distribution, which closely mirrors the typical lifespan of coins.
As we transitioned to the Zarcanum era, with its emphasis on hidden amounts, we at Zano undertook our own research to develop an appropriate algorithm for decoy set selection. The Zarcanum era represents a significant advancement in our blockchain's capabilities, warranting this new approach.
Background
The distribution pattern of spent outputs is influenced by various factors, including the typical behavior of the average user. Hence, the typical distribution of coin lifespan for most tokens/blockchains is remarkably similar.
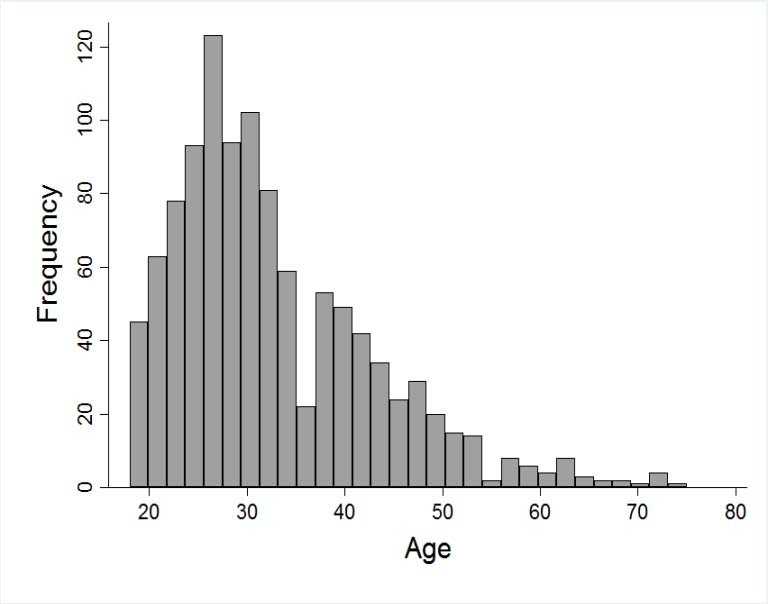
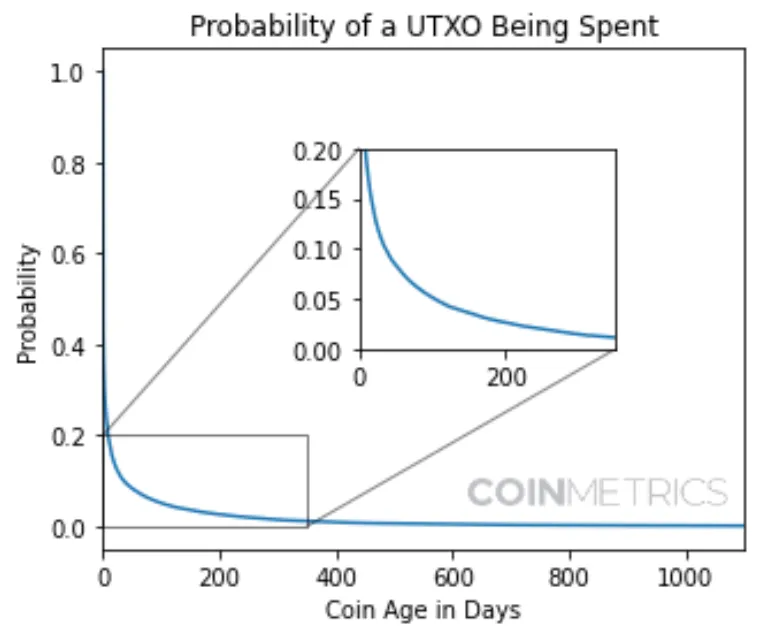
These patterns, however, can shift during key historical events, like significant price changes or major news. Our assessment will focus primarily on these basic patterns.
In addition to user behavior, which may be influenced by psychology, external events, or the state of the network, the distribution can be affected by the activities of large services handling a significant volume of transactions. For instance, mining pools often have a distinct pattern of consolidating coinbase-generated transactions within a short time frame. Additionally, wallet algorithms for coin selection (relevant to projects like Bitcoin, Monero, and Zano, but not to Ethereum-like networks with a balance tree) can also influence distribution.
Given these factors, we adopted a data-driven approach. Our model's distribution is defined by data points characterizing the distribution typical for Zano. This method allows us flexibility to adjust the distribution in response to evolving blockchain usage trends, without complicating the algorithm itself.
Solution
To gather reliable data on Zano's output usage, we employed three approaches:
- Analyzing data from various real wallets to which we had access.
- Receiving anonymized data from external users.
- Directly analyzing the Zano blockchain.
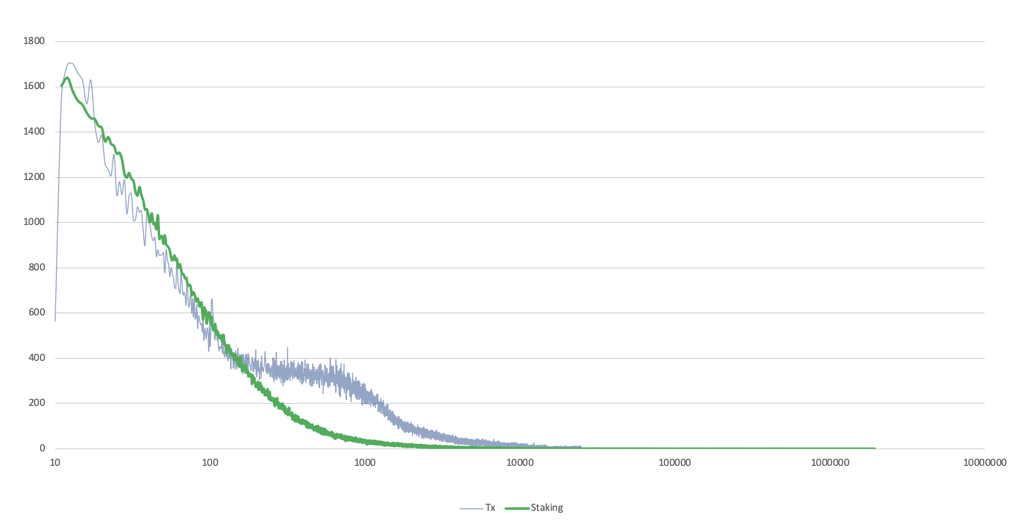
It's crucial to recognize that distribution patterns evolve with the blockchain's growth. The pattern at 100,000 blocks is different from that at two million blocks. We focused on data between blocks 1,700,000 and 2,000,000 to accurately capture current trends. This is the observed distribution of outputs for regular transactions at these heights:
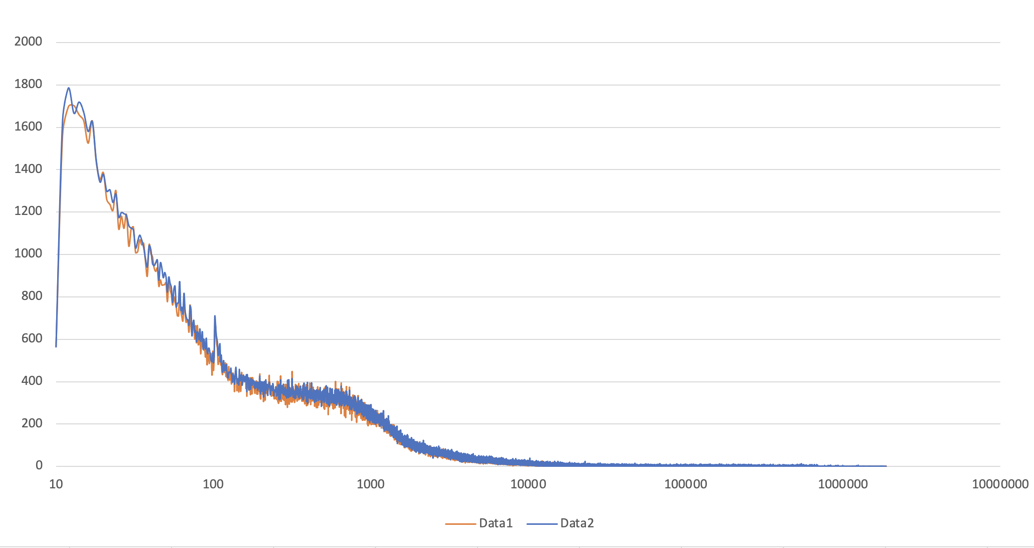
We also examined staking transactions, which displayed a different distribution pattern, further validating our data-driven model choice.
Scaling
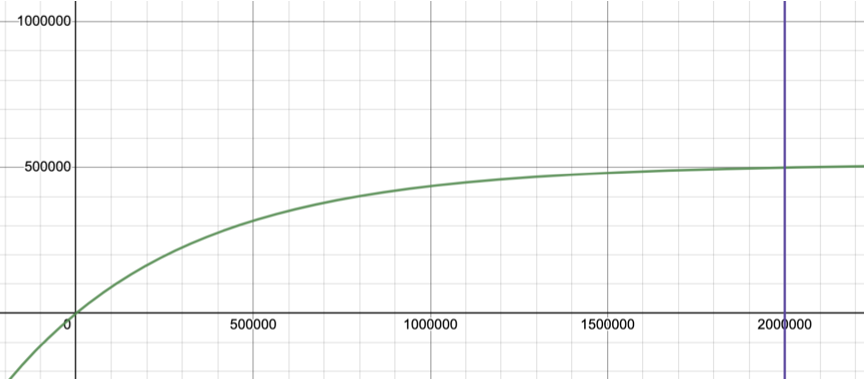
Our model needed to adapt to the blockchain's growth, maintaining relevance regardless of size. We examined how the distribution pattern shifted with changing block numbers. We found a specific function that accurately describes this transformation:
$$ y\left(x\right)=x\cdot a+\ \left(1-e^{-\frac{1}{y_{m}}\cdot x}\right)\cdot y_{m}\ \cdot\ \left(1-a\right) $$
$$ k=\frac{x_{m}}{y_{m}} $$
$$ a=\frac{e^{-k}}{k-1+e^{-k}} $$
Where \( x_{m} \) is the height at which the reference distribution is fixed, and \( y_{m} \) is the height into which the projection is made. Thus, if the projection is done in the direction of compression, then \( k > 1 \), and if in the direction of expansion, then \( k < 1 \).
This function allowed us to project our reference distribution accurately from a height of 2,000,000 blocks down to 500,000.
We tested the new algorithm using data collected at a chain length of 1,800,000 blocks, projecting it to 20,000 blocks. The results closely matched the real data we gathered, affirming the accuracy of our default distribution model.
Conclusion
Our decoy selection algorithm is designed to be adaptable, reflecting the current network usage patterns. We use a table form to approximate the pattern curve for flexibility. Future research may indicate the need for adjustments, and our approach allows us to respond swiftly to such changes. Looking ahead, we are hopeful for the development of full membership proof. This advancement could elevate CryptoNotes' privacy to an unprecedented level, potentially making the decoy selection algorithm obsolete.